 Defenders of Justice
It has been 10 years since the end of the Great Recession. After a decade of a uniquely slow economic recovery, North Carolina’s economy seems to be doing OK on the surface. And yet, despite low levels of unemployment, and overall positive job creation numbers, as well as an increasing population, far too many working families in North Carolina still do not earn enough money to pay for basic needs, let alone thrive. Despite their hard work, many families are being left behind and left out of our state’s economic growth.
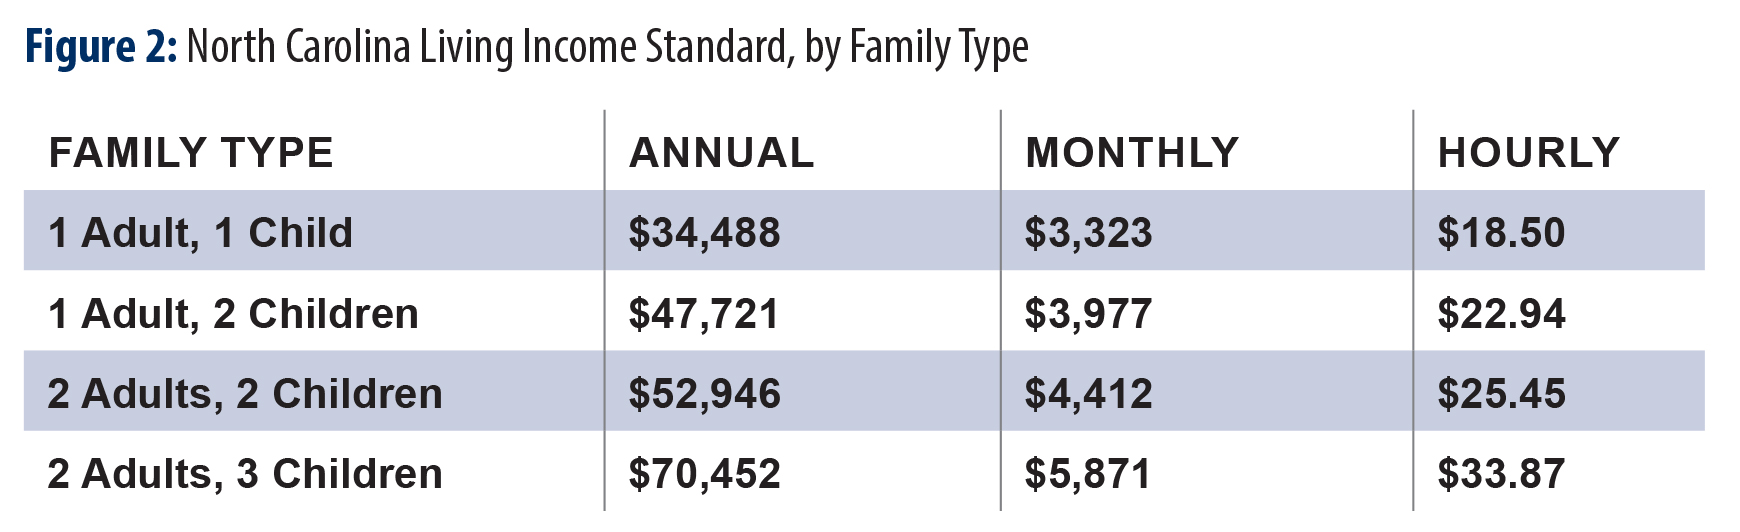
Many families do not earn enough to pay for their basic needs. And many more live paycheck to paycheck and don’t earn enough to save in order to plan for their future or invest in their children and their education. In North Carolina, a family of four must earn $52,946 a year in order to afford housing, food, child care, health care, transportation, taxes, and other necessities.
Families are pursuing various strategies to cope with the low-wage labor market.
- A growing number of workers have more than one full-time job.
- Some workers are choosing to live farther from their workplaces to save on housing costs, which often results in increased transportation costs.
- Others use family and social networks to secure child care and transportation at lower costs.
- In some cases, families postpone major expenses, such as needed car repairs; go without; or increase their debt load to finance unexpected expenses.
 While these strategies can help a family get by on a monthly basis, they represent a significant strain on their well-being as well as a barrier to their economic security and mobility.
Without focused attention on policies that create quality, well-paying jobs, the promise of work for such families will continue to fall short. And without strong income supports and investments in the skills and education of the current and future workforce, North Carolina’s low-wage workers will be continually thwarted in their efforts to advance to the middle class.
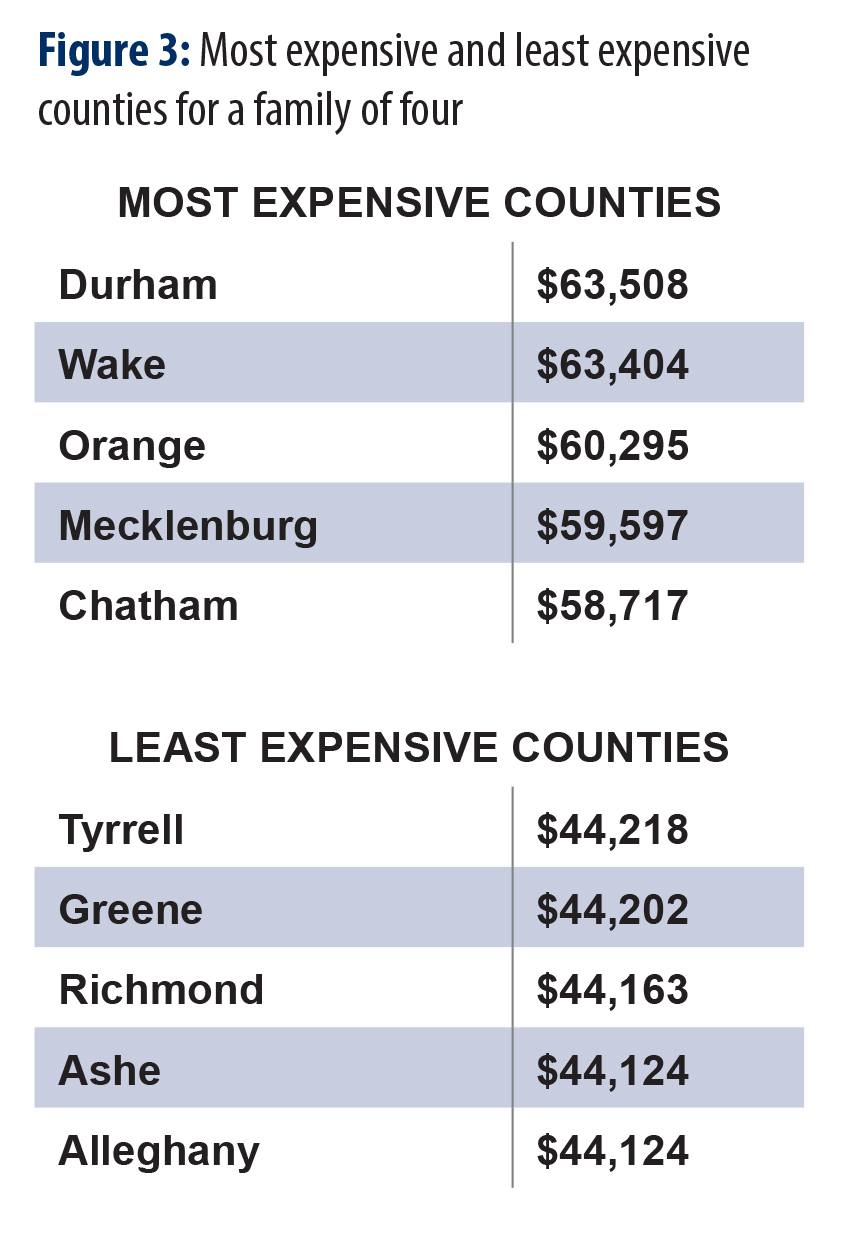
The LIS provides a more accurate and comprehensive picture than more traditional measures of what it takes for a family to make ends meet in each of North Carolina’s 100 counties. The LIS corrects these shortcomings and provides a clearer picture of the true extent of the challenges facing a growing number of North Carolinians, which in turn can help guide policymakers in their efforts to create more ladders to the middle class and widespread prosperity.
To meet the LIS, adults in an average four-person family would need to earn a combined $25 an hour, working full time. Yet, if current employment and industry trends continue, fewer and fewer jobs in North Carolina will meet this wage standard.
Problems with current income standards
Knowing what it truly takes to make ends meet is critical for setting the rules of our economy so that it can operate a) at its highest possible levels b) for the longest period of time and c) include the highest number of people in our state. Unfortunately, the two most commonly used standards for income — the Federal Poverty Level (FPL) and minimum wage standard — have eroded over time and fail to reflect the needs of a modern household in today’s economy.
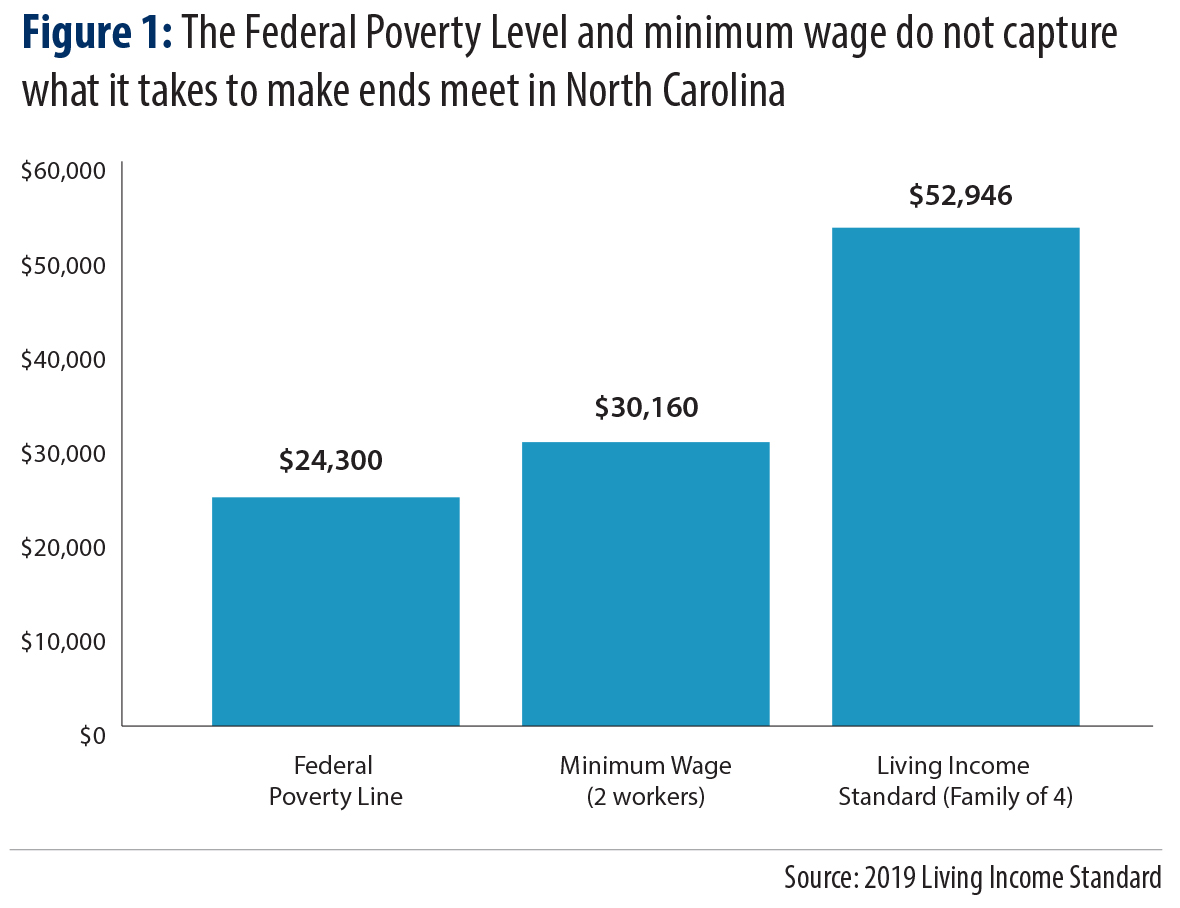
Created in 1962, the FPL was the federal government’s attempt to estimate how much a typical family needed earn in order to afford basic needs. The measure was based off of the costs of groceries and assumed a typical household spent one-third of its income on food. Since its creation nearly 60 years ago, the FPL has only been adjusted for inflation. There have been no changes to adjust for the exponential rise in the costs of housing, healthcare, or child care. Additionally, the FPL does not take into account the different costs of living across the nation.
Likewise, the minimum wage standard is ineffective at reflecting what it takes to make ends meet because it was never intended to do anything more than represent a basic pay floor. Rather than reflect the economic or lived realities of workers, the minimum wage standard has been largely governed by a policy process that fails to reflect the best evidence of what a minimum wage standard needs to reach to provide some stabilizing support to the labor market. Most significantly, the minimum wage standard’s purchasing power has eroded over time because it has not kept up with inflation nor the increase in worker productivity.
A more accurate reflection of what it takes to makes ends meet, such as the Living Income Standard, can help policymakers, employers, and workers understand the kinds of jobs that are available in the economy, the gap between what workers earn and what they need to get by, and as a measure of how the economy itself is faring and delivering economic security.
The essential costs of work drive household budgets
 The LIS uses local costs for essential goods and services to establish how much income a family needs to afford those goods and services. Costs are determined for families of various types: a family with one adult and one child, a family with one adult and two children, a family with two adults and two children, and a family with two adults and three children.
Public datasets, such as those available through the U.S. Census Bureau and the Department of Food and Drug Administration, are used to estimate how much money is required to pay market prices for expenses, including housing, food, child care, health care, transportation, taxes, and other necessities (clothing, personal care items, household supplies, school supplies, and telephone service).
The LIS is based on conservative cost estimates for each budget item and doesn’t include entertainment, meals eaten outside the home, cable television, costs for extracurricular school activities, and gifts. The food budget is based on a thrifty food plan developed by the USDA which assumes families cook every meal at home and buy in bulk. The child care costs are set to the family-based care with three-star ratings, not the high-quality standard recognized to deliver the greatest long-term benefit to children and communities. The LIS also assumes that families only incur the most essential of travel expenses. Transportation costs include only travel to work, school, the doctor, and necessary errands. There is no allotment made for travel for shopping, vacations, or even attending social and recreational activities.
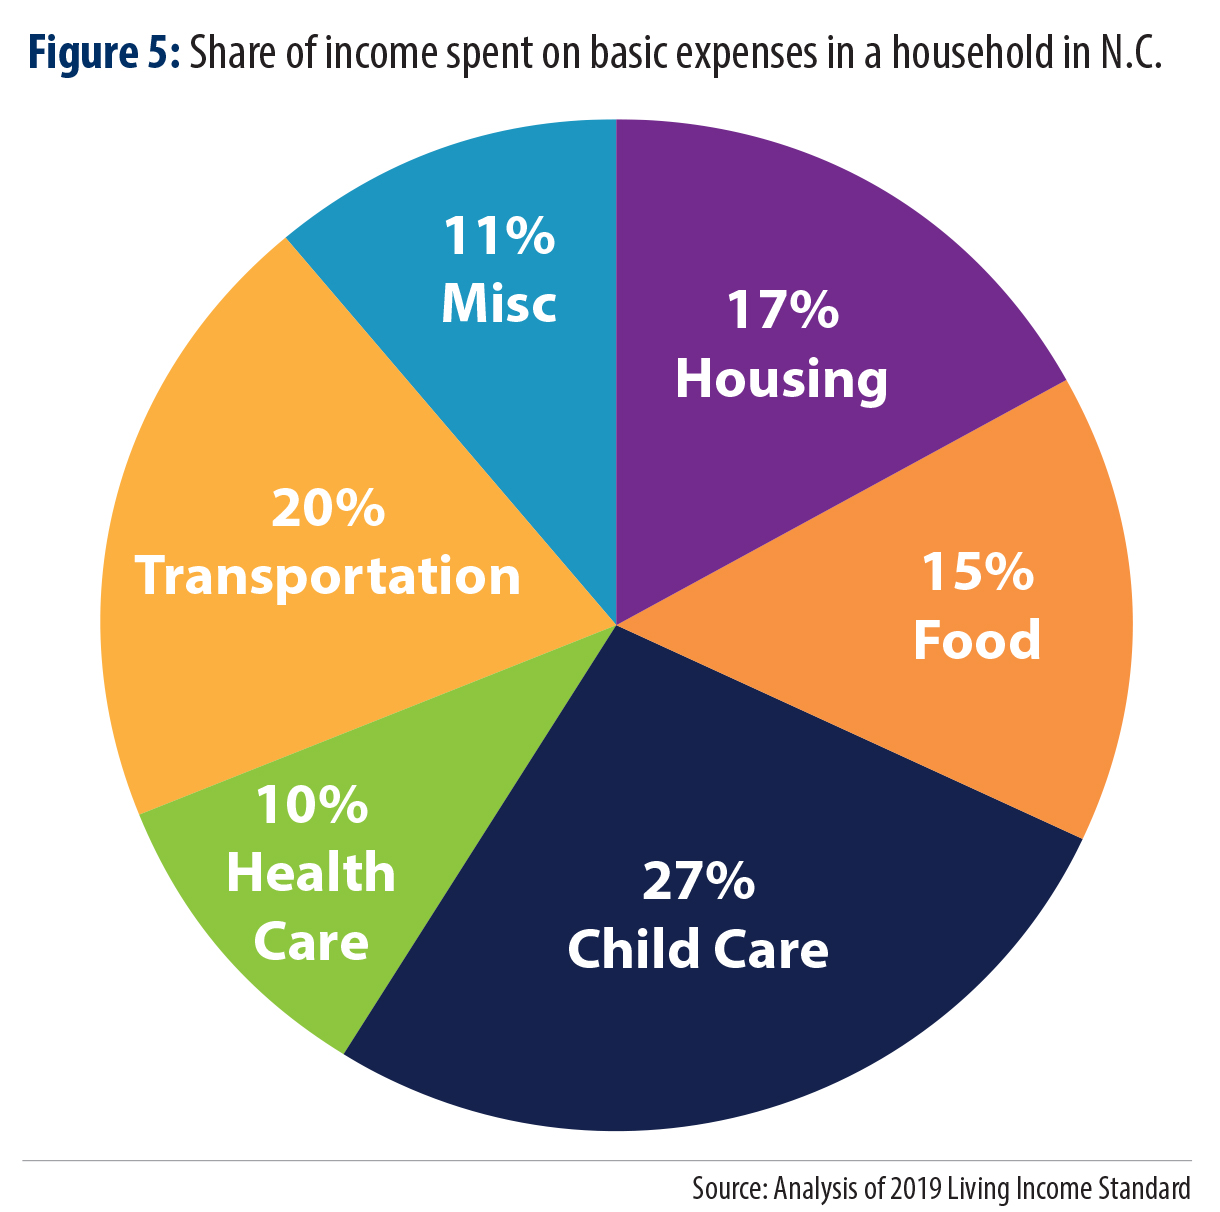
A breakdown of the average household budget to make ends meet by budget category shows the greatest costs in the household budget are often the result of work. Childcare represents the largest component of the household budget, with transportation and housing coming in a close second. Significant to this breakdown are two findings: Health care is a declining share of the household budget in large part due to the ACA, and transportation and housing combined reflects the largest share of a household budget.
Ideas for putting the Living Income Standard to work
- Participate in the Economy Boosting Job Challenge: Help us collect information on public perceptions of job quality in their communities and the local costs of the basics.
- Host a community meeting: Gather your friends and neighbors for a discussion of the living income standard and what can be done locally to support good, quality job creation.
- Talk with your local elected officials: Educate your policymakers about the importance of a Living Income Standard and ask for their support for local “living-wage” ordinances or state initiatives that would help low-wage working families.
- Use the Living Income Standard to make policy when possible: While recent legislative leaders have placed even greater limits on the ability to set local policies that support goals for strong economies, there remain opportunities to use the Living Income Standard in setting wage standards for public-sector workers and for allocating economic development dollars to quality job creation.
- Work with businesses in your community: Identify businesses that pay a living wage and support and promote them and their business model. Just Economics, a non-profit organization in Asheville, has a toolkit on voluntary living income standard certification programs that recognize employers who pay a living wage according to a standard that they have locally defined. Consider working with business leaders to jumpstart a local push for recognition of living income standards established by employers.
Living Income Standard doesn’t reflect incomes necessary to build savings
While the Living Income Standard provides a more accurate picture of the income families need to make ends meet, income, on its own, is not enough to guarantee families a path to the middle class. Savings are critical in equipping families with the tools they need to weather unexpected hardships such as an illness, loss of job, or even something as routine as car repair. Additionally, savings are critical in providing families with the capital they need in order to pursue middle class investments such as homeownership, entrepreneurship, and education.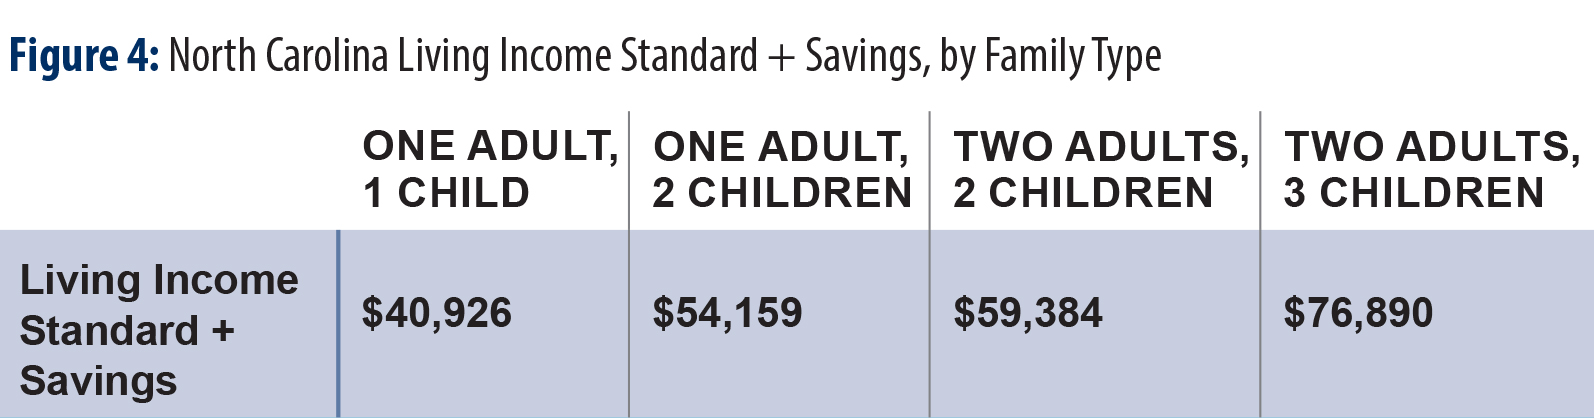
A family that is “asset secure” typically means that family has enough savings and assets to be able to live at the federal poverty line, without income, for three months. Families that are “asset poor” do not have enough savings or assets, such as a home or business they could sell, to support themselves at the Federal Poverty Level for three months. For a family of four, this means a family with less than $6,438 in savings. According to Prosperity Now, more than 25 percent of North Carolina households are asset poor, and nearly 52 percent are “liquid asset poor,” meaning they do not have enough cash savings for a safety net in case of a family emergency.
A Living Income Standard that seeks to meet the goal of setting aside savings in one year would require households to have incomes much higher than the Living Income Standard. Understanding what families need to avoid asset poverty is critical in determining benchmarks for policies and programs that are designed to ensure economic security for families.
Investing in North Carolina’s unemployment system, expanding access to medical insurance through Medicaid expansion, and reinstating the state Earned Income Tax Credit are all ways to help ensure North Carolina’s families are financially stable. A North Carolina that works for all is one that ensures that families not only survive, but thrive.
Appendices: Data by County
There are a couple of ways to access the county-level data for the Living Income Standard:
- Google Sheets: You can access the budget for each family type and for the LIS + Savings by clicking the tabs at the bottom of this link.
- PDF: Download the PDFs from the report at these links:
- Appendix B: Detailed Living Income Standard Budgets by Family Type by County
- Appendix C: Living Income Standard with Savings and Debt Components by County
Appendix: Methodology
The 2019 Living Income Standard (LIS) is a market-based approach for estimating how much income a working family with children needs to afford basic expenses. The LIS uses actual cost data to approximate how much money is required for four representative family types to pay seven basic expenses: 1) housing, 2) food, 3) childcare, 4) health care, 5) transportation, 6) other necessities, and 7) taxes.
Raw data for the LIS come from a variety of federal and state sources. For each budget item, the most conservative estimate is used. Food costs, for example, are based on the U.S. Department of Agriculture’s “Thrifty Food Plan,” which assumes that a family always buys bulk groceries, prepares every meal at home, never eats out, and seldom purchases meat. By using conservative estimates, the LIS provides a basic budget for an extremely modest, if not austere, lifestyle.
The LIS also generally excludes the value of work supports, such as SNAP (formerly known as food stamps) or Section 8 housing subsidies, for which a family might be eligible. Exceptions include an allowance for public health insurance, non-group health insurance subsidies, and certain tax credits. These exceptions are made because health insurance coverage can greatly reduce a family’s income needs while the tax credits offset the effects of regressive tax policies. By excluding the value of work supports, the LIS shows how much a family would need to earn to meet its basic needs without any assistance.
Most of the procedures underlying the LIS are based on the work of the Economic Policy Institute (EPI), a nonprofit research organization in Washington, D.C.
Below are detailed descriptions of the methods used to craft the LIS. Unless noted, all data are for 2019, and all dollar figures represent 2019 values. Where necessary, dollar amounts from earlier years have been adjusted to their 2019 equivalents by using the U.S. Bureau of Labor Statistics’ Consumer Price Index for all urban consumers (CPI-U).
1. Family Types
According to the U.S. Census Bureau, nearly 1.3 million families with children reside in North Carolina. Owing to the impossibility of creating detailed budgets for every family, the LIS constructs budgets for four representative family types. The following chart summarizes the characteristics of each model family.
2. Geography
To reflect regional variations in living costs, the 2019 LIS generates budgets for each family type in all 100 North Carolina counties.
3. Housing
The LIS assumes that families rent rather than own their own homes. This is consistent with national research showing that low-income households are more apt to rent their homes.
Housing costs are based upon the U.S. Department of Housing and Urban Development (HUD) Fair Market Rent (FMR) values for each county in the 2019 fiscal year. FMR is a survey estimate of the actual market rent for a modest apartment in the conventional marketplace. FMR measures shelter rent and the cost of all tenant-paid utilities except for telephone, cable and internet service. Area FMR values are set at the 40th-percentile rent. This means that 40 percent of the units in an area rent for less than the FMR, and 60 percent rent for more.
Assumptions about the appropriate size of an apartment mirror HUD’s occupancy standards. HUD guidelines state that parents and children should have separate bedrooms and that two children can share a bedroom. Therefore, the LIS assumes that two-, three- and four-person families require a two-bedroom apartment, while a five-person family requires a three-bedroom apartment.
In 2019, monthly FMR for a two-bedroom apartment in North Carolina ranged between $679 and $1,553. Monthly FMR for a three-bedroom apartment varied from $851 to $1,553.
4. Food
Food costs are based on the January 2019 Thrifty Food Plan developed by the U.S. Department of Agriculture (USDA). The Thrifty Plan, which is the basis for the Supplemental Nutrition Assistance Program—formerly known as food stamps—allotments, reflects the estimated costs associated with purchasing the food required to prepare a nutritionally sound diet at home. There is no allowance of any kind for meals purchased outside of the home or eaten at any kind of restaurant.
Plan costs are tied to the age and gender of the adults and the age of the children. For infants, the plan costs for a 1-year-old are used. For preschoolers, the plan costs for a 4- to 5-year-old are used. For school-aged children, the plan costs for a 6- to 8-year-old are used. As to not assume the gender of the primary caretaker or exclude same-sex households, the average costs for males and females between the ages of 19 and 50 are used for parents.
5. Child care
Child-care costs are based on the Child Care Market Rates reported by the NC Department of Health and Human Services’ Division of Child Development and Early Education. The LIS assumes that all adults in a family work full-time, and all children—infants, preschoolers, and school-aged children—require regular, age-appropriate care in licensed family childcare homes that have received a three-star rating from the North Carolina Division of Child Development. North Carolina rates all licensed childcare providers on a five-star scale. A one-star rating means that a facility meets basic standards. Additional stars are awarded to facilities that meet higher quality standards in terms of staff education and program standards. Many factors such as transportation and work schedule force families to choose child care options close to where they work and live. Although a one-star facility may be less expensive, it may not be feasible for a family to choose that care center. The LIS accounts for this by using three-star facilities as the baseline for childcare costs.
6. Health Care
Health expenses are difficult to measure due to a lack of definitive data and the range of potential coverage options. Families may purchase coverage through an employer-sponsored group plan, obtain non-group insurance through the private market, receive public insurance, or go uninsured. For North Carolinians obtaining non-group insurance through the private market, they may receive a subsidy based on their individual or family income per the Affordable Care Act.
Premium and out-of-pocket costs for each option may vary greatly. Because health insurance is vital to a family’s well-being, the LIS assumes that every family member is covered by some kind of insurance plan.
For families with employer-sponsored health insurance, the LIS bases the cost on the average private-sector employee’s share of premium costs. This figure comes from the 2017 Medical Expenditure Panel Survey (MEPS) sponsored by the U.S. Department of Health and Human Services. The annual estimate is divided by 12 to produce a monthly cost estimate, and this figure is then adjusted for inflation using the CPI-U for medical care.
For families with non-group health insurance, monthly premium costs are derived from the 2019 Federally Facilitated Marketplace Qualified Health Plans Landscape files available through the website of the U.S. Department of Health and Human Services, which provides the costs for every plan and family type and each of the state’s 100 counties.
More specifically, non-group health insurance quotes are generated for the “Lowest Cost Silver Plan” for each county for adults 30-years-old and for children (whose rates are the same because they are under 18 years old). It is assumed that families do not use tobacco products. Actual prices would increase by 20 percent for tobacco users. Because the LIS aims to reflect a modest standard of living, it is assumed that every family purchasing non-group health insurance earns 150 percent of the Federal Poverty Level and qualifies for a subsidy under the Affordable Care Act (ACA). Per the rules of the ACA, at that income level, the maximum non-group health insurance premium each family pays is 4 percent of their family income. Because the estimates generated for each family type exceeds this maximum in every county, the LIS uses the 4-percent rule (i.e., 4 percent multiplied by 150 percent of the Federal Poverty Level for each family type) to determine the final estimate for non-group health insurance for each family type.
To estimate out-of-pocket medical costs, the LIS uses 2010 MEPS household survey data specific to the Southern region and selected age groups. For each family type, the appropriate MEPS results for the “Total Amount Paid by Self/Family” are summed, divided by 12 to yield a monthly amount, and adjusted for inflation using the CPI-U for medical care.
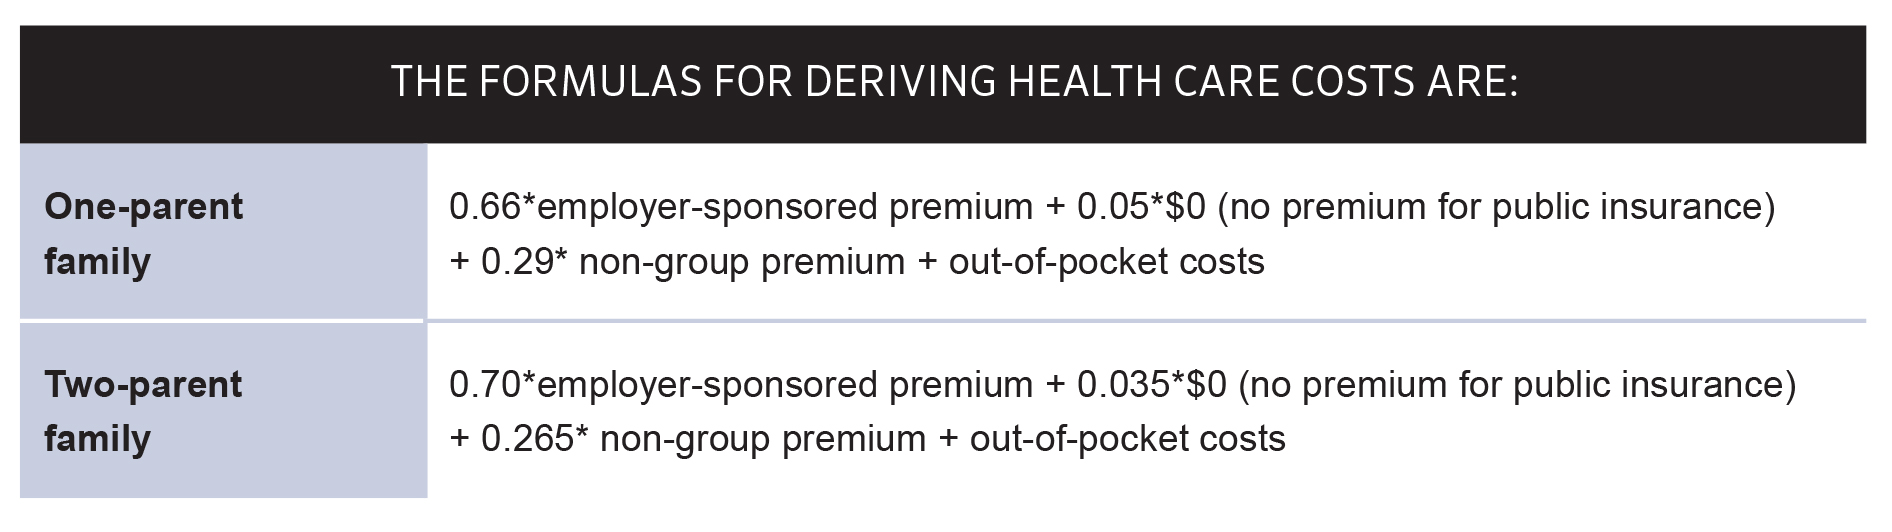
Finally, health care costs for each family type are generated by using a weighted formula developed by EPI. Formula weights reflect the percentages of families with modest incomes that have employer-sponsored, non-group and public insurance, as measured by the U.S. Census Bureau’s 2004 Current Population Survey. While the LIS normally does not include the value of public insurance, some of the representative family types would be eligible for public insurance like the Health Choice for Children program. Such coverage would greatly reduce both a family’s health care costs and the amount of income needed to meet basic expenses.
The formulas for deriving health care costs are as follows.
7. Transportation
The LIS assumes that a family relies upon a private automobile to travel to work and school, as well as to conduct essential family business. Automobile travel is North Carolina’s dominant mode of transportation due to low-density settlement patterns, a general separation between employment and residential centers, and relatively limited public transit networks. In fact, more than 80 percent of North Carolina workers commute to their jobs by themselves in a private automobile, according to the U.S. Census Bureau.
Raw transportation data come from two sources: the 2017 National Household Travel Survey (NHTS) sponsored by the U.S. Department of Transportation and the 2019 per-mile deduction rate computed by the U.S. Internal Revenue Service (IRS). The IRS per-mile rate (58 cents) measures the cost of owning, repairing, maintaining, and registering an automobile.
To estimate transportation costs for each family type, a four-step process is used.
First, the state’s 100 counties are classified as urban or rural based on the population density of each of the state’s counties. Counties with a population density of 300 people per square mile or more were considered Urban. All other counties are considered Rural.
Second, NHTS data showing the average annual vehicle-miles per driver are calculated for urban and rural North Carolinians. The appropriate values (averages for urban and rural state residents) then are assigned to each county based on its urban or rural classification. The 17 urban counties are given a value of 12,172 miles per driver per year. The state’s 83 rural counties are assigned a value of 13,332 miles per driver per year.
Third, NHTS travel-day data are analyzed to isolate the annual person-miles of travel strictly for work and non-social purposes (using the 1990 trip purpose variable). For the typical North Carolina driver, work trips account for 21.3 percent of the total number of miles driven each year, and non-social trips, like school meetings or medical appointments, account for 36.2 percent of the total number of miles driven each year.
Finally, a formula developed by EPI is used to generate a monthly estimate for transportation costs based on the number of adults in a family. The formulas are as follows.
![]()
8. Other Necessities
Other necessary expenses incurred by families with children include clothing, personal care items, household supplies, reading materials, school supplies, and telephone service. Based on an analysis of the U.S. Bureau of Labor Statistics’ Consumer Expenditure Survey, other necessities are valued at 12.3 percent of total household expenditures, excluding savings contributions. Note the LIS contains no allowance for such items as entertainment, meals eaten outside of home, cable television, extracurricular activities, and gifts.
9. Taxes & Credits
Tax costs are computed for each family type using a tax calculator created by the Budget & Tax Center. These tax costs include federal personal income tax, federal Social Security and Medicare payroll taxes (employee-portion only) equal to 7.65 percent of pre-tax wages and state income taxes.
This method also produces the amounts a given family would receive from three federal tax credits: the Earned Income Tax Credit (EITC), the Child Tax Credit, and the Child and Dependent Care Credit. As a result of changes made to North Carolina tax code in 2013, only an additional amount for the state Child Tax Credit (CTC) is included in the tax calculator.
All family types included in the study are eligible for the entire $2,000 per child federal Child Tax Credit and federal Child and Dependent Care Credit.
Tax changes made to North Carolina’s tax code in 2013 changes the structure of the personal income tax from a three-tier rate structure to a flat tax rate. For 2019, the personal income tax rate is 5.25 percent for all tax filers, regardless of income level.
Given the necessary income to cover basic expenses for families, all of the one adult, one infant families and most of the two-children families qualify for the EITC. While the LIS generally does not include the value of work-support benefits, the value of the EITC is included because it is a tax benefit that offsets the regressive nature of payroll and excise taxes.
To calculate specific tax amounts for each representative family, the after-tax family budget necessary to meet basic needs is identified by totaling the annual cost of food, housing, childcare, health care, transportation, and other necessities for each family type within each North Carolina county. The Budget & Tax Center tax calculator is then used to determine the pre-tax income necessary for families to achieve the after-tax family budget necessary to meet basic needs. The tax calculator computes the payroll and federal income taxes, the value of the federal credits, North Carolina income taxes, and the value of the state tax credit for each pre-tax income.
For one-adult households, the “head of household” filing status is used. “Married Filing Jointly” is used for the two-adult households. The appropriate standard deduction for each family type is used and exemptions are calculated according to the size of each family type.
Families’ annual tax liability on the pre-tax income is divided by 12 and figured into the monthly LIS budget. Where applicable, refunds are applied to the annual pre-tax income to calculate the final annual LIS for each family type in each county.
Other taxes are accounted for in the appropriate budget item. Gas taxes, for example, are included in the transportation estimate. Similarly, an estimate for property taxes is included in the housing data, while the value of sales taxes is captured in the price of other necessities.
10. Income and Wage Calculations
After compiling budget data for each line item for each family type in each county, the values are summed to show the total amount of money that a family would need to meet its basic expenses. Annual totals then are converted into monthly and hourly wage figures. These figures represent the total amount of income that a family requires to meet its budget. For two-parent families, the total represents how much income the family must earn from the combined efforts of both adults.
For comparative purposes, the annual income figures also are shown as a percentage of the federal poverty threshold. The hourly figures are expressed as a percentage of the state’s 2019 minimum wage of $7.25 per hour.
Consistent with conservative estimating techniques, the hourly wage figures are based on the assumption of full-time employment, meaning 40 hours per week for 52 weeks per year. Put differently, the LIS makes no allowance for a worker taking any unpaid time off. Also, research suggests that low-wage workers often are unable to work consistently and instead are subject to unexpected layoffs and changes in hours. As a result, the hourly LIS wage represents a best-case scenario, and the hourly wage actually needed is likely higher.
To create a statewide figure, the LIS uses a weighted average. First, the budgets for the four family types in each county are averaged to create a county-level figure. Those county level figures then are turned into a weighted average, in which the weight reflects each county’s share of the state’s total population. Population estimates come from the 2018 figures prepared by the State Demographer.