Prosperity Watch (Issue 85, No.1)
April 3, 2018
Children’s educational success across the country is being undermined by budget cuts that – in most states – have led to reductions in investments in each child, cuts to teacher pay and benefits, and under-funding of the tools that promote reading proficiency and high school completion.
In its annual review of state investments released last fall, the Center on Budget & Policy Priorities ranked North Carolina among the 29 states that are still spending below pre-Recession levels for the education of each child in K-12. North Carolina still remains 7 percent below per-pupil spending levels when compared to when the recovery began in 2009.
Teachers, school personnel and parents in West Virginia, Kentucky, Oklahoma and Arizona are objecting to these artificial constraints with demonstrations of just how foundational public education is to the community. Cuts and underinvestment in children’s education is made worse in states where policymakers have also cut taxes. For example, corporate tax rates in Arizona were cut by 30 percent in 2006, while personal income tax rates were cut by 10 percent just five years later. In Oklahoma, the personal income tax rate cuts began in 2004, which were followed by cuts to the severance tax on oil and gas, the exemption of capital gains income from taxation, and elimination of the estate tax.
In North Carolina, corporate income tax rates have been cut by 56 percent since 2013, and the state’s graduated rate on personal income tax that began at 6.25 percent has been reduced to a flat rate of 5.499 percent. Both corporate and personal income tax rates are scheduled to be cut again in January 2019.
New data released by the Education Law Center demonstrates how holding down investments in public schools could be addressed if state leaders chose to align their tax code with their economic capacity. The report uses a measure of funding that estimates the effort made by each state to fund public education as a share of their gross domestic product (the productivity of their economy primarily gained from corporate income and proceeds from natural resources). Under this measure of fiscal effort, North Carolina ranks third to last by spending just $27 for every $1,000 generated in economic productivity. North Carolina’s fiscal effort has fallen by eight percent from pre-Recession levels. The average across all states and the District of Columbia is $35 for every $1,000 in economic productivity.
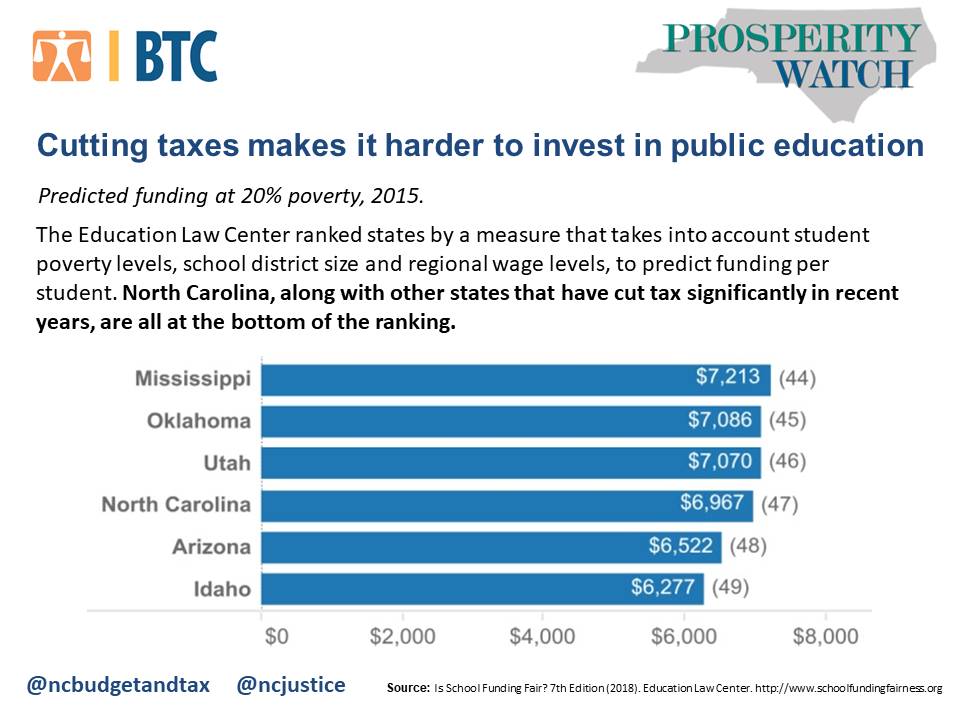
An additional measure of funding modeled by the Education Law Center takes into consideration student poverty levels, school district size and regional wage levels, and it finds similar results. North Carolina ranks at the bottom of the states, with a funding level of $6,967 per pupil at the poverty level of 20 percent, which is roughly the national average rate. This means that the funding for a student in North Carolina is just 37 cents for every dollar of funding for a child in New York public schools. Also at the bottom are other states that have cut taxes significantly in recent years, including Idaho, Arizona, Mississippi and Oklahoma.
The report specifically notes that North Carolina has failed to provide a sufficient base level of funding for children’s education despite having the capacity to do so.
 Justice Circle
